Projects
This is a showcase of my best work and a demonstration of my ability to lead, execute campaigns, analyze data, collaborate with others, interpret the results, and create actionable recommendations.
Building and Managing Social Media of Behavior Analysis Clinic
I used to work as a therapist at a behavior analysis clinic. The clinic did very little marketing, so I volunteered to help build their marketing efforts from scratch. The company president wanted me to help grow the company's Facebook page activity and reach.
I began by auditing the company's Facebook and then brainstormed content ideas. I wrote the captions, designed graphics with the Adobe suite, and maintained a consistent schedule of posts. I collaborated with supervisors and followed HIPAA regulations for client privacy, as we were a medical facility.
This campaign resulted in growth across Facebook reach, visits, and follows over 17 months. Reach grew by 2.2K%, visits by 451.3%, and follows by 23.8%.
Attached are line graphs to the right illustrate this growth (from the Meta Business Suite), and samples of the content I made for the Facebook page, including ads, infographics, and staff spotlights.


Creating a Branded Slide Deck for Internal and External Presentations
The company I worked for did not have an official PowerPoint template. Our account executives would often create their own presentations for meetings with prospects, and they were often devoid of our brand elements. I was tasked with creating a branded PowerPoint template that could be used for internal and external presentations.
I consulted our brand guidelines and asset libraries to design the PowerPoint, and I also researched best practices for templates. I collaborated with individuals across our teams to learn what kind of slides and elements they needed, and incorporated feedback from them. I also included documentation of our brand guidelines, wrote guides for using different elements of the template, and added an asset library to increase accessibility for other team members.
The template received favorable reviews and was used in our internal and external meetings (sales, webinars).


Increasing Social Media Reach for Local Improv Comedy Troupe
People I met at a local improv class formed a troupe and performed throughout Pinellas county. After being offered to perform with them, I also volunteered to help them grow their Facebook presence.
To do this, I first audited the troupe's social media efforts at the time. I then created a brand style, brainstormed content ideas, designed graphics, wrote captions, and maintained a calendar of posts, scheduling at least three posts a week.
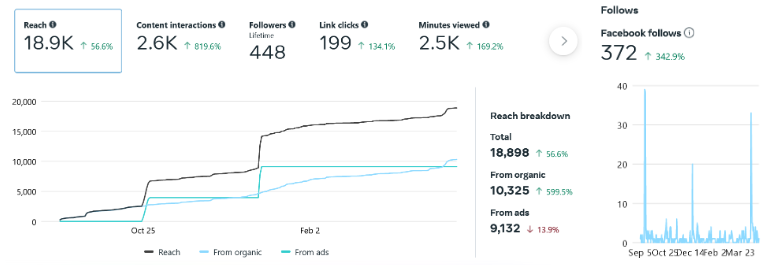
The results showed major growth in a matter of months. Facebook reach grew to over 6,000 only two months after the campaign began. From September 5th, 2023 (campaign start date) to April 30th, 2024, Facebook reach grew to 18.9K (a 56.6% increase), visits grew to 6.1K (820.8% increase), and followers grew to 372 (342.9% increase). I continued to do marketing for them even after I left the troupe.
Attached are some graphics I made to promote shows and line graphs from the Meta Business Suite showing the page's growth over the campaign duration.


Increasing Efficiency of Social Media Workflow using AI
My company instituted a push for AI (Claude) incorporation. I was tasked with making a part of my daily workflow more efficient with AI, so I decided to incorporate it into social media caption writing.
To do this, I created an agent using Claude Cowork that would write the post, send it for review, and update it based on my manager's feedback. It allowed me to write, edit, and update captions from one environment instead of hopping between multiple platforms. I also created documentation and packaged it into a shareable plug-in for other team members to use.
The result was that a post that used to take an hour or so to write now took 10 minutes at most to complete. It gave me more time to write other posts or work on other tasks.
Generative Engine Optimization Research and Strategy
The marketing team was interested in how our company appeared in LLM results. My manager tasked me with researching our Generative Engine Optimization and AI visibility and to create content recommendations based on my findings.
To do this, I used Semrush to research the topics and prompts we appeared for and wanted to appear for, our share of voice, and our competitors' performances across five LLMs. I compiled this data and my actionable recommendations into a PowerPoint presentation and presented it to the marketing team.
These recommendations were later incorporated into a greater content creation campaign focused on increasing our SEO and GEO. I was also a key contributor to this later campaign.
Collecting, Visualizing, and Reporting Data Using Tableau for Class Project
While pursuing my Master's degree, I enrolled in a Data Visualization class as part of the Marketing Analytics specialization. For the final project, we had to come up with an independent research question, find datasets to answer it, create visualizations using Tableau, and write a report on our findings. My research question asked if higher average temperatures were correlated with higher marriage dissolutions rates and counts in Florida.
To answer this question, I gather temperature data from the NOAA and marriage dissolution data from the Florida Department of Health. I cleaned the datasets in Excel before linking them and creating the visualizations in Tableau. I created multiple graphs, including line graphs, bar charts, map charts, and scatterplots. I also included changeable parameters so that viewers could see change over time or by category.
Based on my findings, I concluded that there was no correlation between higher average temperatures and marriage dissolution rates and counts. I received a A grade on this project.
Some visualizations from my project are shown below. You can also view a PDF of the Tableau packaged workbook here.


